
Schulenberg and Associates, LLC (since 1981): Originators of the Thermodynamic Approach to Stock Market Prediction
Schulenberg and Associates LLC is a company that specializes in innovative software products and solutions, and with a special emphasis on the design of numerical algorithms. Our experience with stock market timing and equity modeling began in 1987 when we added neural network capabilities to our EDES™ (Empirical Data Expert System) program. EDES/Model™ continues to be our primary tool for the generation of the many dozens of small, cascaded artificial neural networks that, along with thousands of Expert System rules, form an important part of our stock market signal generation software. Development of our Stock Strategist ™ software began in 2002, and we have been continuously publishing the daily Newsletter and market timing reports since October 2004. Currently, our daily prediction model for the S&P 500 (SPYPRED5) is probably the most accurate such model in the world, having been evolved over a 22 year period.
Our Newsletter can now be found on Substack.

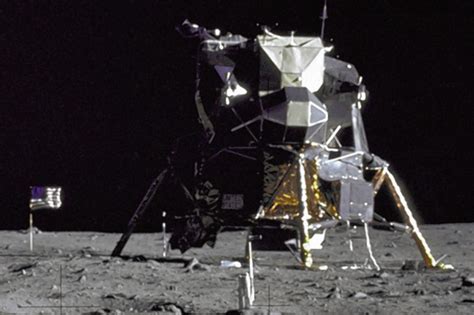


After graduating from the University of California at Berkeley (Mathematics/Physics), Craig W. Schulenberg began his software development career at the MIT Instrumentation Laboratory in Cambridge, Massachusetts (now the Charles Stark Draper Laboratory). While a member of the Apollo team, he was responsible for integrating the LM flight software builds for Apollo 11 (LUMINARY), and for the programming and testing of the Lunar Module (LM) onboard guidance computer software for the Lunar Ascent (P12), Aborts during the Lunar Descent (P70,P71), and the final phases of the lunar landing itself (P66,P67).
In addition to supporting the Apollo program, he subsequently developed Flight Software code, or algorithms, or analytical software/requirements tools, first for the Space Shuttle (STS), then for the James Webb Space Telescope (JWST), then for the Orion capsule (requirements analysis tools), and finally for the Ares I launch vehicle (Constellation program) and the follow-on Space Launch System (SLS).
Some additional biographical information can be found in Gary B. Smith's archived Real Money™ articles: On the Comp, a Bounce Then a Leg Down? and The Dow Nears Its Jump Zone.
Our Major Stock Market Prediction Innovations
Schulenberg Stock Strategist™ (SSS) "Maxwell-Boltzmann" Stock Market Timing Models
 The basis for the Stock Strategist™ is an entirely new approach to viewing the stock market, that is, from a thermodynamic standpoint. In thermodynamics, the Maxwell-Boltzmann distribution describes the relationship between the absolute temperature of a gas and the percentage of molecules that will have speeds within specified limits. This relationship works both ways: given a distribution of molecular speeds you can determine the temperature of a gas, and given the temperature of a gas you can determine the molecular speed distribution. We utilize an analogous concept in determining the effective temperature of the stock market. We call this value the MTI (Market Timing Indicator), although the acronym might also be considered to stand for "Market Temperature Indicator". Instead of gas molecules we consider an ensemble of over 8500 stocks and ETFs; instead of looking at the number of gas molecules within specified speed ranges we consider the distribution of "long" holdings within a spectrum of specially designed stock portfolios (with unusual buy and sell criteria). In a way, this is Technical Analysis ... but firmly rooted in the fundamental forces that underlie the stock market.
Grail System™ Stock Timing Models
The MTI (Market Timing/Temperature Indicator) that is generated by the thermal model in our Preprocessor is used to develop customized short-term timing models for 1,000 stocks and ETFs. These Grail System™ models utilize the MTI value, multiple neural networks, as well as both traditional and proprietary technical indicators (based on price and volume), in order to generate daily buy/sell signals. These highly accurate signals are tuned to the intrinsic (natural) characteristics of each individual stock (average maximum drawdown and trading frequency).
The intrinsic values (AMD-Average Maximum Drawdown, and trading frequency) are determined by performing an analysis of the entire price history for a given stock, using Monte-Carlo techniques to evaluate hundreds of thousands of possible trades. The objective is to maximize the annualized gain, and the only restriction imposed is that any trade must be held for at least 4 trading days. When this analysis is complete, the natural trading frequency and associated Average Maximum Drawdown are then available. This data is then fed into the optimization process for each of our custom models so that our model values (AMD and trading frequency) can be 'coaxed' to converge to these natural values. This process produces a stock timing model that reflects the natural rhythm of the stock or ETF, and since it is MTI-based, it quickly reacts to the overall temperature of the stock market.
|
Generalized Candlesticks (the RaDiSH Transform™)
 Although our short-term signals (Grail System™) are based on our Market Timing (Temperature) Indicator (MTI), and are thus thermally-based, they do not operate on a sufficiently reactive time scale to be able to predict the daily movement of a single equity like QQQ (since the temperature of the stock market can't change very much in a single day). Instead, we turn to an elegant generalization of Japanese Candlesticks. By applying our proprietary transform (RaDiSH Transform™) we can convert the four daily prices (High, Low, Open, Close) plus volume, into a set of 5 dimensionless and time-invariant numbers. Then, by using this data to train a neural network we can predict the average price that a given stock 'may' exhibit on the next trading day (the sum of the High and Low prices divided by 2). Finally, by looking at the actual Open price of QQQ, together with this estimated average price for the next day, we can calculate the probability that QQQ will Close higher than its Open. This gives us a QQQ day-trading signal that is probably about as accurate as is theoretically possible. A sample Prediction Table report can be seen here. Although our short-term signals (Grail System™) are based on our Market Timing (Temperature) Indicator (MTI), and are thus thermally-based, they do not operate on a sufficiently reactive time scale to be able to predict the daily movement of a single equity like QQQ (since the temperature of the stock market can't change very much in a single day). Instead, we turn to an elegant generalization of Japanese Candlesticks. By applying our proprietary transform (RaDiSH Transform™) we can convert the four daily prices (High, Low, Open, Close) plus volume, into a set of 5 dimensionless and time-invariant numbers. Then, by using this data to train a neural network we can predict the average price that a given stock 'may' exhibit on the next trading day (the sum of the High and Low prices divided by 2). Finally, by looking at the actual Open price of QQQ, together with this estimated average price for the next day, we can calculate the probability that QQQ will Close higher than its Open. This gives us a QQQ day-trading signal that is probably about as accurate as is theoretically possible. A sample Prediction Table report can be seen here.
|
ETF Decomposition of Mutual Funds
Our Mutual Fund Timing Indicator (MFTI) was developed using our Stock Market Timing Indicator (MTI) as a basis, and this works very well to identify those protracted periods when mutual funds (as an investment class) are in either a 'buy' or a 'sell' state. However, the task of developing buy/sell/hold signals for individual mutual funds requires a different approach. Simply looking at the recent price history of a fund shows its current performance, but offers little insight as to how the fund will perform over the next month or two. Our solution is to try to determine the current holdings of the mutual fund, and then to use our intermediate-term buy/sell/hold (and short-term buy/sell) signals to calculate a weighted signal for the entire fund.
Our approach is to decompose each mutual fund into a weighted sum of 5 different ETFs (basis vectors) that are chosen from a large set of 175 ETFs. Monte-Carlo methods are then used to determine the 5 'best' ETFs, and their associated weightings, that reproduce the recent price history of the mutual fund most accurately. These decompositions are often uncannily accurate, and correlation coefficients (R**2) of 0.9900 or better are routinely achieved. While these decompositions can never exactly reflect the current holdings of a mutual fund, they nonetheless give us an analytical way of assigning a net Score (and a buy, sell, or hold recommendation) for over 1,100 funds on a daily basis. A sample mutual fund decomposition report can be seen here.
|
Differential Signals -- Comparing Two Indices
By employing a mathematical device we can utilize our Grail System™ techniques to generate models for new 'signals' that predict the relative performance of one index against another. We actually utilize ETFs for this purpose, and the objective is to predict whether, for example, QQQ (the Nasdaq 100) will outperform (or underperform) the S&P 500 (SPY), the DOW (DIA), or the Russell 2000 (IWM) over the near-term. A '+/-' value for the $NQ-RU signal, for example, would mean that a simultaneous Long of QQQ and a Short of IWM (i.e., a hedged situation) would likely be profitable; a '-/+' signal would suggest a profitable QQQ Short while going Long on IWM. We currently generate a total of 31 differential signals, and a recent Differential Signals report can be seen here.
|
Last Changed: 09/17/23